


;)
;)

근원 PCE 물가지수는 상승, 연준 FOMC 자이언트 스 텝
 이미지 확대보기
30일 뉴욕증시에 따르면 미국 상무부는 미국의 헤드라인 PCE가 전년대비 6.2% 올랐다고 발표했다. 7월의 6.4%에 비해 낮아졌다. 반면 근원 PCE는 4.9%로 7월의 4.7%보다 높아졌다. 헤드라인 PCE 상승률이 하락 한것은 미국 연준의 금리인상 속도조절 기대를 낳고 잇다. 문제는 근원 PCE물가이다. 근원 PCE는 4.9%로 7월의 4.7%보다 높아지면서 연준의 금리인상 속도 조절에 한계가 있을 것으로 보인다. 연준의 자이언트 스텝 금리인상이 예상된다.
이런 가운데 골드만삭스는 미국의 인플레이션이 정점을 찍었다는 전망을 재확인했다. 골드만삭스는 "근원 PCE 물가의 정점이 지났다고 계속해서 보고 있다"면서 올해 12월 근원 개인소비지출(PCE) 물가는 4.2%를 나타낼 것"이라고 전망했다. 당초연말 전망치는 4.5%였다. 지난 7월 미국의 근원 PCE 가격지수는 전년대비 6.4% 올랐다. 이는 40년 만에 최고치를 기록했던 6월의 7.0% 상승에 비해 상승률이 크게 둔화한 것이다. 연말까지 2.1%포인트 더 떨어질 것으로 골드만삭스는 예상하고 잇다.
30일 아시아 시장에서 미국 국채 금리는 PCE 물가 지표를 앞둔 경계감에 혼조세 였다. 28일 미 국채 금리는 영국중앙은행(BOE)의 긴급 국채 매입 조치에 급락했으나 29일에는 반등했다. 연준 관계자들의 매파 발언이 이어진데다 일부 경제 지표가 호조를 보인 영향이다. 스터 클리블랜드 연방준비은행 총재는 영국의 상황에서 배운 교훈 중 하나는 연준이 "인플레이션을 낮추는 데 있어 성실해야 한다는 점"이라며 "여전히 미국 기준 금리는 제약적인 수준에 있지 않다"고 말했다. 금리 인상 중단 가능성을 일축한 것이다.
이런 가운데 주간 신규 실업보험 청구자 수(계절조정 기준)는 전주보다 1만6천명 감소한 19만3천 명으로 집계됐다. 독일 9월 소비자물가지수(CPI)는 전년 대비 10.0% 폭등해 1951년 12월 이후 최고 상승률을 기록했다. 미국과 유럽의 긴축이 지속될 것이라는 전망이 채권 금리 하단을 떠받치고 있다.
29일 뉴욕증권거래소(NYSE)에서 다우존스30산업평균지수는 전장보다 458.13포인트(1.54%) 하락한 29,225.61로 거래를 마쳤다. 스탠더드앤드푸어스(S&P)500지수는 전장보다 78.57포인트(2.11%) 밀린 3,640.47로, 기술주 중심의 나스닥 지수는 전장보다 314.13포인트(2.84%) 하락한 10,737.51로 장을 마감했다. S&P500지수는 올해 저점을 또다시 경신했다. 장중 저점(3,610.40)도 다시 썼다. 애플 주가가 큰 폭으로 하락하면서 투자 심리가 크게 악화했다. 연준 당국자들은 경제가 경착륙할 가능성을 작게 보고 있으나, 영국의 금융시장 불안으로 시장의 의구심은 가시지 않고 있다.
미국의 2분기(4~6월) 미국의 실질 경제 성장률은 마이너스(-) 0.6%를 기록해 두 분기 연속 마이너스 성장세를 기록한 것으로 확정됐다. 미국 상무부에 따르면 계절 조정 기준 2분기 국내총생산(GDP) 확정치는 전기 대비 연율 0.6% 감소했다. 이는 앞서 공개된 잠정치와 같은 수준이며, 월스트리트저널(WSJ)이 집계한 시장 예상치와도 같다. 지난 1분기 -1.6%에 이어 두 분기 연속 마이너스를 기록하며 기술적 침체에 진입했다. 반면 미국의 실업률이 3.7% 수준으로 여전히 매우 낮아 침체와 거리가 멀다는 분석이 지배적이다. 시카고상품거래소(CME) 페드워치에 따르면 연방기금(FF) 금리 선물 시장에서 연준이 11월에 금리를 0.75%포인트 인상할 가능성은 57.7%로 전날의 56.8%와 비슷한 수준을 보였다. 0.50%포인트 인상 가능성은 42.3%로 전날의 43.2%와 비슷했다. 시카고옵션거래소(CBOE) 변동성 지수(VIX)는 전장보다 1.66포인트(5.50%) 오른 31.84를 나타냈다.
미국 PCE 물가지수 보도자료
Personal Income and Outlays, August 2022 and Annual Update
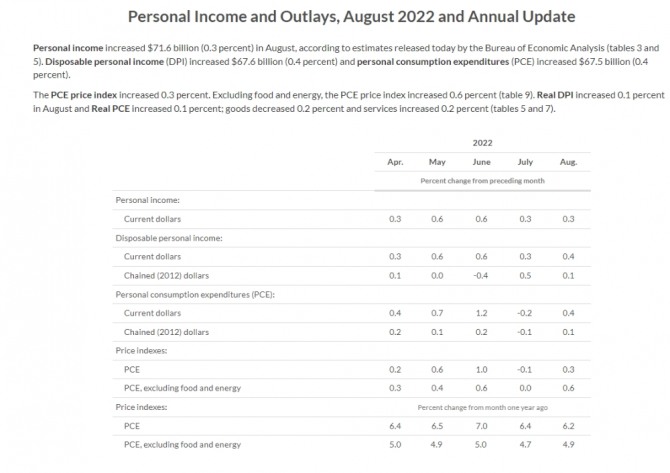
Personal income increased $71.6 billion (0.3 percent) in August, according to estimates released today by the Bureau of Economic Analysis (tables 3 and 5). Disposable personal income (DPI) increased $67.6 billion (0.4 percent) and personal consumption expenditures (PCE) increased $67.5 billion (0.4 percent).
The PCE price index increased 0.3 percent. Excluding food and energy, the PCE price index increased 0.6 percent (table 9). Real DPI increased 0.1 percent in August and Real PCE increased 0.1 percent; goods decreased 0.2 percent and services increased 0.2 percent (tables 5 and 7).
2022
Apr. May June July Aug.
Percent change from preceding month
Personal income:
Current dollars 0.3 0.6 0.6 0.3 0.3
Disposable personal income:
Current dollars 0.3 0.6 0.6 0.3 0.4
Chained (2012) dollars 0.1 0.0 -0.4 0.5 0.1
Personal consumption expenditures (PCE):
Current dollars 0.4 0.7 1.2 -0.2 0.4
Chained (2012) dollars 0.2 0.1 0.2 -0.1 0.1
Price indexes:
PCE 0.2 0.6 1.0 -0.1 0.3
PCE, excluding food and energy 0.3 0.4 0.6 0.0 0.6
Price indexes: Percent change from month one year ago
PCE 6.4 6.5 7.0 6.4 6.2
PCE, excluding food and energy 5.0 4.9 5.0 4.7 4.9
The increase in current-dollar personal income in August primarily reflected increases in compensation, proprietors' income, and government social benefits that were partly offset by a decrease in personal interest income (table 3). The increase in compensation was led by private wages and salaries. Within private wages and salaries, an increase in services-producing industries was partly offset by a decrease in goods-producing industries. The increase in proprietors' income reflected an increase in nonfarm income. The increase in government social benefits was mainly in Medicare.
The $67.5 billion increase in current-dollar PCE in August reflected an increase of $96.9 billion in spending for services that was partly offset by a decrease of $29.4 billion in spending for goods (table 3). Within services, the largest contributors to the increase were spending for housing and utilities, transportation, and health care. Within goods, spending for gasoline and other energy goods was the leading contributor to the decrease. Detailed information on monthly PCE spending can be found on Table 2.3.5U.
Personal outlays increased $67.8 billion in August (table 3). Personal saving was $652.8 billion in August and the personal saving rate—personal saving as a percentage of disposable personal income—was 3.5 percent (table 1).
Prices
From the preceding month, the PCE price index for August increased 0.3 percent (table 9). Prices for goods decreased 0.3 percent and prices for services increased 0.6 percent. Food prices increased 0.8 percent and energy prices decreased 5.5 percent. Excluding food and energy, the PCE price index increased 0.6 percent. Detailed monthly PCE price indexes can be found on Table 2.3.4U.
From the same month one year ago, the PCE price index for August increased 6.2 percent (table 11). Prices for goods increased 8.6 percent and prices for services increased 5.0 percent. Food prices increased 12.4 percent and energy prices increased 24.7 percent. Excluding food and energy, the PCE price index increased 4.9 percent from one year ago.
Real PCE
The 0.1 percent increase in real PCE in August reflected an increase of 0.2 percent in spending on services and a decrease of 0.2 percent in spending on goods (table 7). Within services, health care and transportation services were the leading contributors to the increase. Within goods, "other" nondurable goods (including personal care products, and newspapers, printed materials, and other nondurable recreation items), and recreational goods and vehicles were the leading contributors to the decrease. Detailed information on monthly real PCE spending can be found on Table 2.3.6U.
Annual Update of the National Economic Accounts
Today’s release presents results from the Annual Update of the National Economic Accounts and includes revised estimates for January 2017 through March 2022. The reference year remains 2012.
Revisions to annual estimates of personal income and outlays are shown in table 12. Revised and previously published changes in monthly personal income, DPI, PCE, personal saving as a percentage of DPI, real DPI, and real PCE are shown in table 13. Revised and previously published changes in annual and quarterly estimates are shown in table 14.
Monthly estimates for January through March of 2022 have been updated as part of the annual update, including revisions resulting from the incorporation of first-quarter wage and salary data from the Bureau of Labor Statistics (BLS) Quarterly Census of Employment and Wages program.
Estimates for April through July have been updated to reflect revised monthly data from the BLS Current Employment Statistics program. Revised and previously published changes from the preceding month for current-dollar personal income, and for current-dollar and chained (2012) dollar DPI and PCE, are provided below for June and July.
The increase in current-dollar personal income in July primarily reflected an increase in compensation that was partly offset by decreases in proprietors' income, personal current transfer receipts, and rental income of persons (table 3). The increase in compensation was led by private wages and salaries. The decrease in proprietors' income was mainly in nonfarm income. The decrease in personal current transfer receipts followed an increase in June that reflected a legal settlement from corporate business to persons.
The $23.7 billion increase in current-dollar PCE in July reflected an increase of $33.3 billion in spending for services that was partly offset by a decrease of $9.6 billion in spending for goods (table 3). Within services, the largest contributors to the increase were spending for housing and utilities (mainly housing) and for "other" services (mainly international travel). Within goods, gasoline and other energy goods was the leading contributor to the decrease. Detailed information on monthly PCE spending can be found on Table 2.3.5U.
Personal outlays increased $27.0 billion in July (table 3). Personal saving was $932.3 billion in July and the personal saving rate—personal saving as a percentage of disposable personal income—was 5.0 percent (table 1).
Prices
From the preceding month, the PCE price index for July decreased 0.1 percent (table 9). Prices for goods decreased 0.4 percent and prices for services increased 0.1 percent. Food prices increased 1.3 percent and energy prices decreased 4.8 percent. Excluding food and energy, the PCE price index increased 0.1 percent. Detailed monthly PCE price indexes can be found on Table 2.3.4U.
From the same month one year ago, the PCE price index for July increased 6.3 percent (table 11). Prices for goods increased 9.5 percent and prices for services increased 4.6 percent. Food prices increased 11.9 percent and energy prices increased 34.4 percent. Excluding food and energy, the PCE price index increased 4.6 percent from one year ago.
Real PCE
The 0.2 percent increase in real PCE in July reflected an increase of 0.2 percent in spending on goods and an increase of 0.2 percent in spending on services. Within goods, an increase in durable goods (led by recreational goods and vehicles) was partly offset by a decrease in nondurable goods (led by gasoline and other energy goods as well as by food and beverages). Within services, increases in housing and utilities and in transportation services were the leading contributors. Detailed information on monthly real PCE spending can be found on Table 2.3.6U.
Updates to Personal Income and Outlays
Estimates have been updated for April through June1 . Revised and previously published changes from the preceding month for current-dollar personal income, and for current-dollar and chained (2012) dollar DPI and PCE, are provided below for May and June.
Change from preceding month
May June
Previous Revised Previous Revised Previous Revised Previous Revised
(Billions of dollars) (Percent) (Billions of dollars) (Percent)
Personal income:
Current dollars 128.0 126.7 0.6 0.6 133.5 145.3 0.6 0.7
Disposable personal income:
Current dollars 109.0 107.1 0.6 0.6 120.4 131.9 0.7 0.7
Chained (2012) dollars 1.2 -1.1 0.0 0.0 -45.1 -37.2 -0.3 -0.2
Personal consumption expenditures:
Current dollars 43.3 86.7 0.3 0.5 181.1 169.0 1.1 1.0
Chained (2012) dollars -45.7 -10.7 -0.3 -0.1 16.0 4.6 0.1 0.0
김대호 글로벌이코노믹 연구소장 tiger8280@g-enews.com


